What is a Gantt chart anyway?
Blog / 5. March 2018We always talk about Gantt charts on these blog posts and on the website in general.
Oh, and we also named ourselves after it. So, you might be wondering what we mean with that and why we thought it was important enough to deserve this much attention. And rightfully so!
All credit and thanks for designing Gantt charts goes to this handsome fellow – Henry Laurence Gantt.
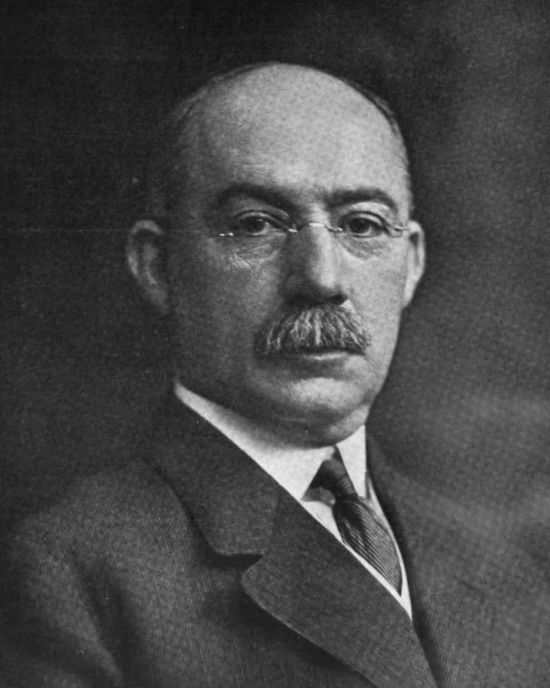
Henry Laurence Gantt in all his glory
Henry was a mechanical engineer and management consultant from America and created the Gantt chart in the 1910s.
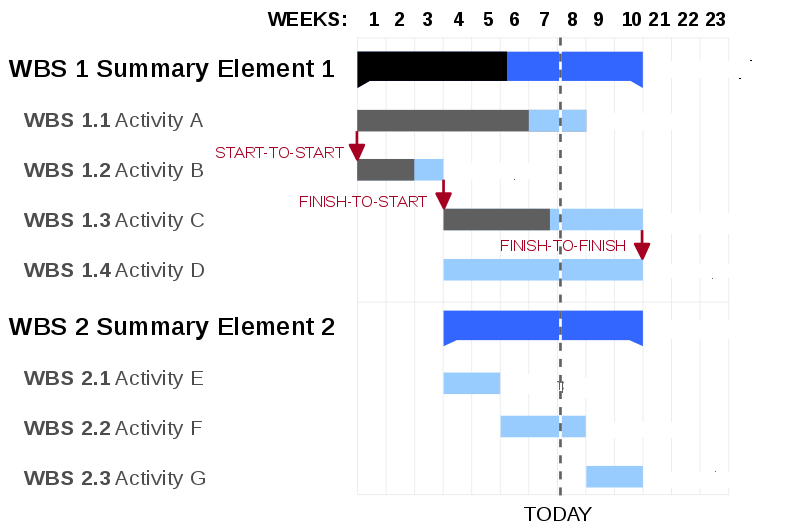
He designed it for a simple purpose: supervisors should be able to get a quick overview over projects, see if they are behind schedule or which tasks are due next.
Mr. Gantt described two views on projects, the “man’s record”, which shows what each person has to do and the “daily balance of work”, which shows what amount of work has been done and the amount that still needs to be done.
Back then you had to redraw the entire thing if you made changes of course. Good ol’ times and all.
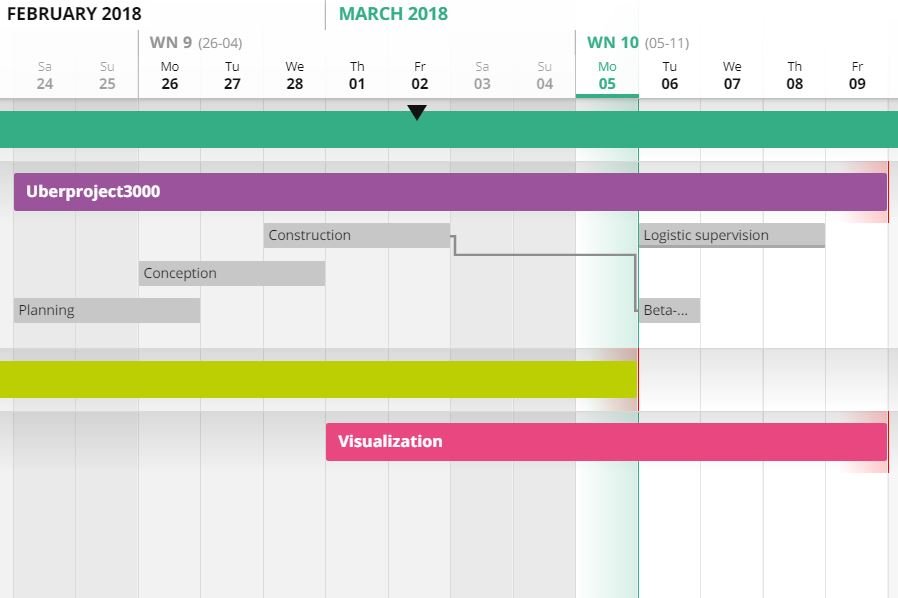
We took all this into account while creating and designing Agantty. We wanted to include a daily overview for projects as seen in the dashboard and still give you a complete overview in the Gantt chart, to make projects as simple and flexible as possible and still not to look like this:
or even this:
Instead we wanted them to be as beautiful as the projects themselves and went with this: